Exploration & description/ANOVA or REML? |
||||||||||||||||||||||||||||||||||||||||||||||||||||||||||
|
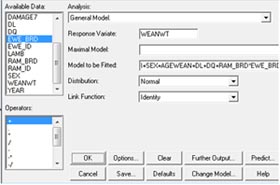
Before using the REML method to estimate genetic variance components we shall rerun the analysis used in Case Study 3 to compare weaning weights of lambs. First we must disregard the lambs for which the response variable weaning weight was not recorded. This can be achieved by using the GenStat Spread → Restrict/Filter By Value... command and excluding missing values (*) for weaning weight This time we shall alter the way that
breed genotypes are defined in the least squares analysis. Instead
of referring to the breeds by their genotype, D X D, D X R, R X D
and R X R we shall consider separate effects for ram breed, ewe
breed and their interaction, and re-parameterise the model
accordingly. We can run this model both by least squares analysis
of variance and by REML. |
|
|||||||||||||||||||||||||||||||||||||||||||||||||||||||||
![]()
![]()
![]()